Prediction
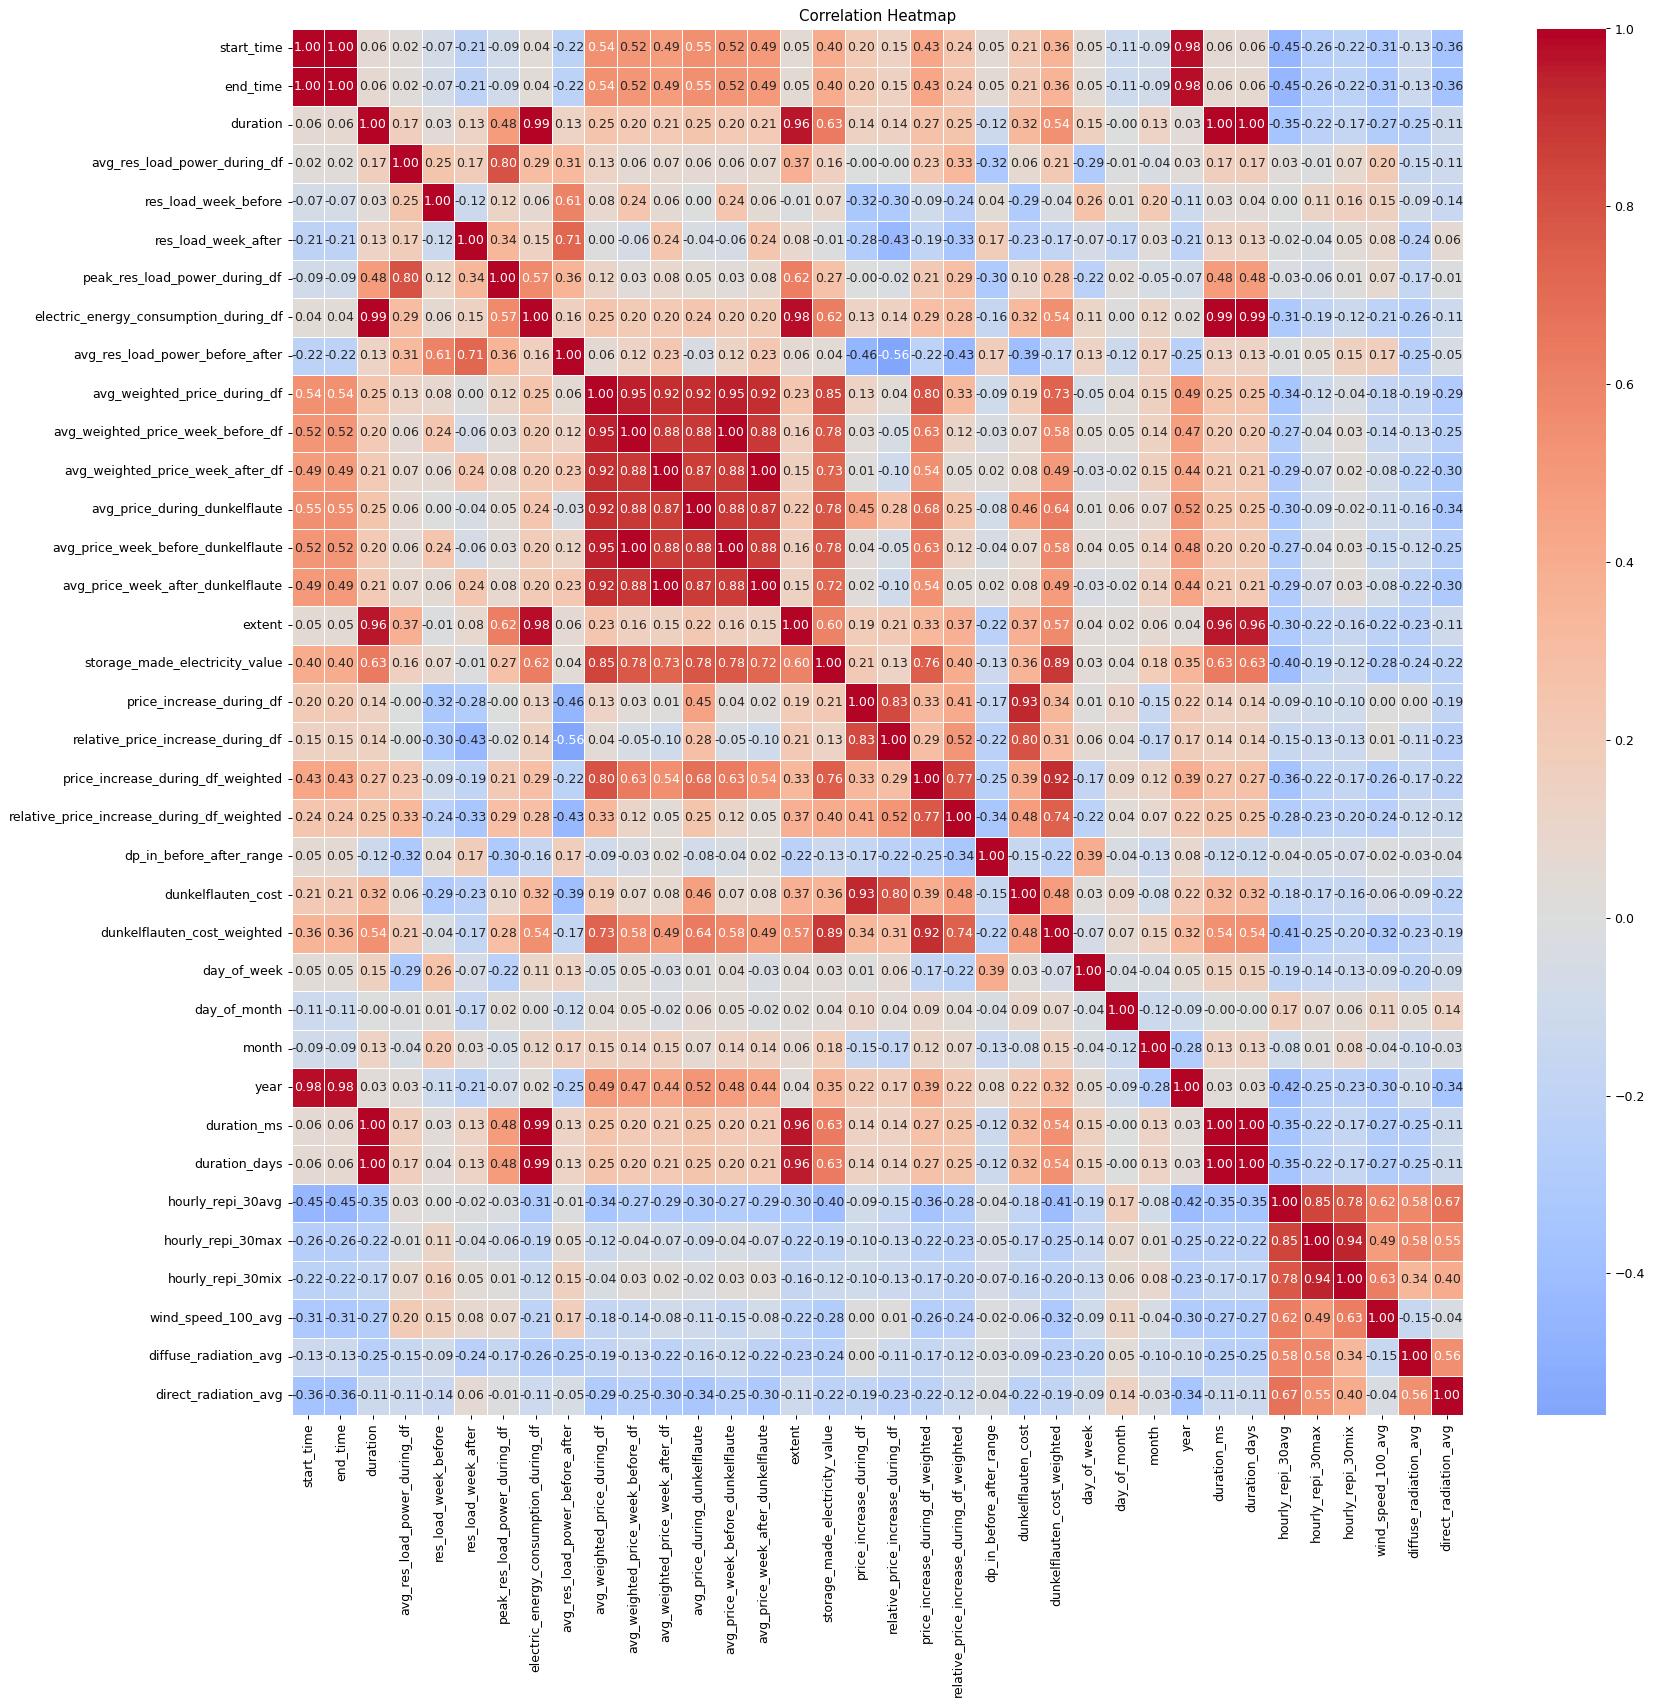
If you are not interested in specific instances of Dunkelflauten, you can see here on this site how the variables
influence each other.
We introduce a new variable called REPI to have a measurement of how much electricity renewables can produce.
It stands for Renewable Production Index.
The writing behind the name stands for the calculation method:
We mainly take 3 compound variables to calculate the REPI:
The average of following 6 spots from the 2 northern rows of Germany make up the situation of the available wind power:
The average of the following 9 spots from the 3 southern rows of Gemany make up the situation of the available PV power:
This selection should reflect the differences of installed capacity depending on the region.
Wind speed and solar radiation can only be converted into electricity fed into the grid if suitable equipment is installed and registered/permitted.
Here you can see the southern dominance of Photovoltaik Power Plants.
On this site, the superiority of installed wind power plants in the north is presented.
We introduce a new variable called REPI to have a measurement of how much electricity renewables can produce.
It stands for Renewable Production Index.
The writing behind the name stands for the calculation method:
We mainly take 3 compound variables to calculate the REPI:
- Wind Speed in 100m height in m/s
- Direct Solar Radiation in W/m^2
- Diffuse Solar Radiation in W/m^2
The average of following 6 spots from the 2 northern rows of Germany make up the situation of the available wind power:
- 51.985939025878906,6.935780048370361
- 51.985939025878906,10.073394775390625
- 51.985939025878906,13.04587173461914
- 54.02460479736328,6.976743698120117
- 54.02460479736328,9.94186019897461
- 54.02460479736328,13.081395149230957
The average of the following 9 spots from the 3 southern rows of Gemany make up the situation of the available PV power:
- 47.97890853881836,7.176079750061035
- 47.97890853881836,10.01661205291748
- 47.97890853881836,13.006645202636719
- 50.017574310302734,7.068062782287598
- 50.017574310302734,10.052355766296387
- 50.017574310302734,12.8795804977417
- 51.985939025878906,6.935780048370361
- 51.985939025878906,10.073394775390625
- 51.985939025878906,13.04587173461914
This selection should reflect the differences of installed capacity depending on the region.
Wind speed and solar radiation can only be converted into electricity fed into the grid if suitable equipment is installed and registered/permitted.
Here you can see the southern dominance of Photovoltaik Power Plants.
On this site, the superiority of installed wind power plants in the north is presented.
        The definition for the well predicting variables are:


                repi_power1avg2 = round( ( least(wind.wind_speed_100_avg, 11)^3
                    + ( radiation.direct_radiation_avg ) *2
                    + ( radiation.diffuse_radiation_avg ) *2
                )::Decimal(8, 4), 2 ),

                repi_power_exp = round(( 1550 * (1- exp(-0.001 * pow(wind_daily.wind_speed_100_avg, 3)))  -- adjusted for a smooth limit, cuts x^3 at x=9.8
                   + radiation_daily.direct_radiation_avg *1.4
                   + radiation_daily.diffuse_radiation_avg *1.4
                )::Decimal(8, 4), 2 ),